TPDB Benchmark

Benchmark Overview

A peptide-focused benchmark covering classification, regression, standardized splits, and model-ready downloads.

Source Code
Classification 23

activity endpoints with 4 dataset strategies and 25 model settings.

Regression 3

property endpoints covering Caco-2 permeability, half-life, and PAMPA.

Evaluation 12

metrics across classification and regression for side-by-side comparison.

Reproducibility 264

downloadable benchmark CSV files for reuse.
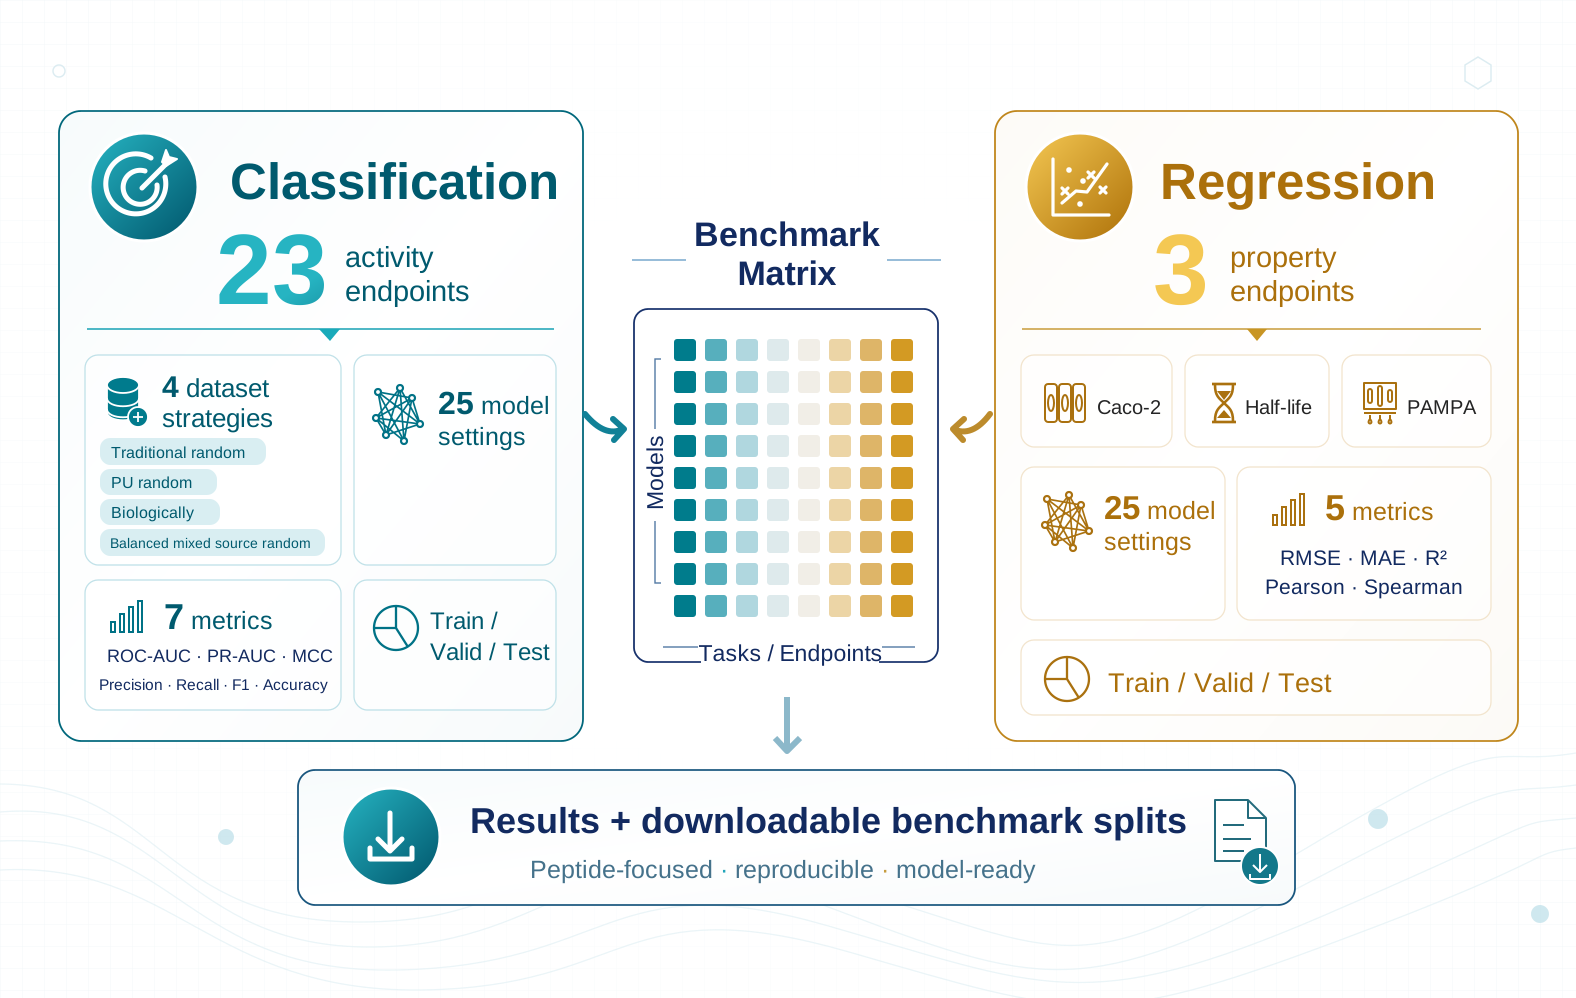
Overview of TPDB benchmark: classification has 23 activities and 25 models; regression has three tasks and 25 distinct model settings, with 12 for Caco-2, 25 for Half-life, and 12 for PAMPA

Cross-Distribution Performance and MS Training
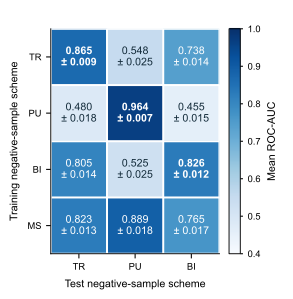
ROC-AUC matrix: rows show TR, PU, BI, and MS training negative-sample schemes; columns show TR, PU, and BI test schemes. Each cell reports the mean and standard deviation.

High matched scores do not guarantee generalization

Matched0.885
→
Cross-distribution0.592

Mean ROC-AUC falls when the negative-sample construction changes.

More consistent performance with MS training

0.826MS mean ROC-AUC

Mixed-source training shows less variation across the three test schemes.

Model Performance and Cross-Distribution Robustness
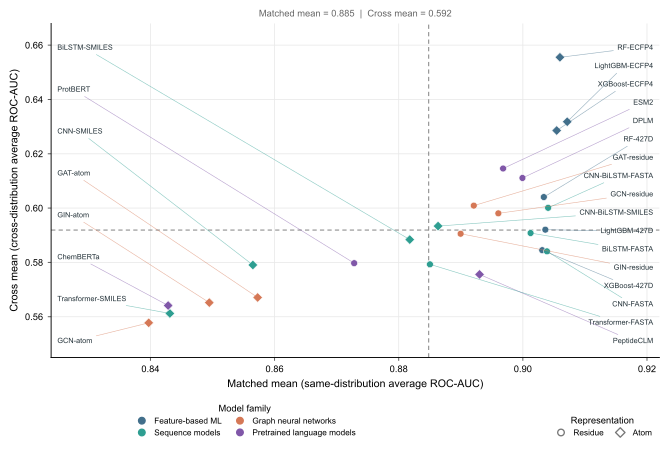
Scatter plot comparing 25 predictive methods: the x-axis is matched-distribution mean ROC-AUC, and the y-axis is cross-distribution mean ROC-AUC. Dashed reference lines indicate the overall means of 0.885 and 0.592. Colors distinguish model families and marker shapes distinguish representation levels.
Same-distribution performance and cross-distribution robustness of the 25 predictive methods. Dashed lines indicate the overall matched mean (0.885) and cross mean (0.592); colors denote model families and marker shapes denote representation levels.